| Product/Customer Raw Data Report |
|
|
The Raw Data Report provides you with product and customer data from a group of invoices. It's the same data that is used by Product Reports, except that it's in raw form - and it includes all customers whether they have a customer or not - and all products whether or not they have a catalog number. Once the data is in a spreadsheet, you can manipulate to create your own customized reports. To generate the raw data, start at the Main Invoice Screen and select PRODUCT TOOLS >> PRODUCT REPORTS.
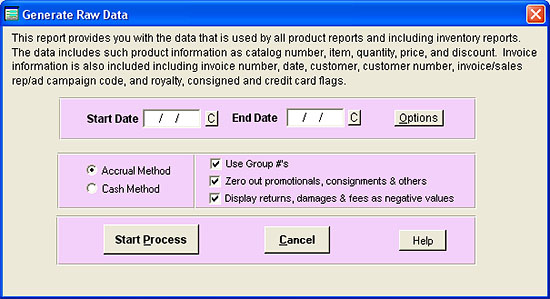
Click on the "Raw Product Revenue Data" button. The following appears:
Report Options Enter the dates (or click on the "Options" button and select one of the date options). You have several reporting options: Accrual or Cash. You can based the report on accrual or cash accounting. The "Accrual Method" creates a report with all transactions for the range of dates that you indicate. AnyOrder uses the invoice date for this report. If the invoice date is within the time period, then the transaction is included. "Cash Method" includes only those transactions paid during the range of dates. For a cash report, AnyOrder uses the Paid Date. AnyOrder will include all sales transactions if the paid date falls within the range of dates. For sales transactions, the invoice date has no bearing on a "Cash" report. It's the paid date that is important. The only exception are returns and damages. When it comes to returns and damages, it will use the invoice date. An accrual accounting report is, by far, the most common and is selected as the default. Use Group #'s. When this is checked, all customers within a billing group will be assembled together. The default for this option is checked. If you remove the checkmark, then the report will list activity for each customer, rather than grouping them together. Zero-out promotionals, consignments and others. When this box is checked, the the "Amount" column in the report (see sample below) will be set to zero (0) for any item with "P" or "C" sales code. The "P" sales code means "promotional" item. The "C" sales code means "consigned" item. Thus, when this box is checked, any promotional item or any consignment item will be shown as a zero in the "Amount" column. (Note that the "Amount" column is named "Price" if you move the data to Excel.) What is the "Amount" column? It is the quantity times price-each minus any discounts provided to the customer: (Quan X Price @) - Discount. Note that because of limited space, the checkbox is labeled "promotionals and consignment" but this option includes more than just "P" and "C" codes. It includes any other sales code which calculates the amount as a zero (0) on the invoice. So, it also will set the "Amount" column to zero (0) for the following codes: Take-back (T),Hold Orders (H), Back or Hold order shipped (X), No Longer Available (N), Unacceptable Returns (U), Internal Use Code (I), and Inventory Adjustment (A). The box is checked by default, and for most uses, you'll keep that way, but if you need the values from these codes, remove the checkmark. Display Returns, Damages & Fees as Negative Values. When this box is checked, returned items, damaged items, and other credits (such as fees charged by customers) appear as negative values on the report. This is the default choice and is handy for most reports since it allows you to sum the "Amount" column (named "Price" on the Spreadsheet) and obtain the total with credits (returns, damages and fees) removed. If you'd rather have these displayed as positive values, remove the checkmark. The Report When you click on "Start Process," the following report appears:
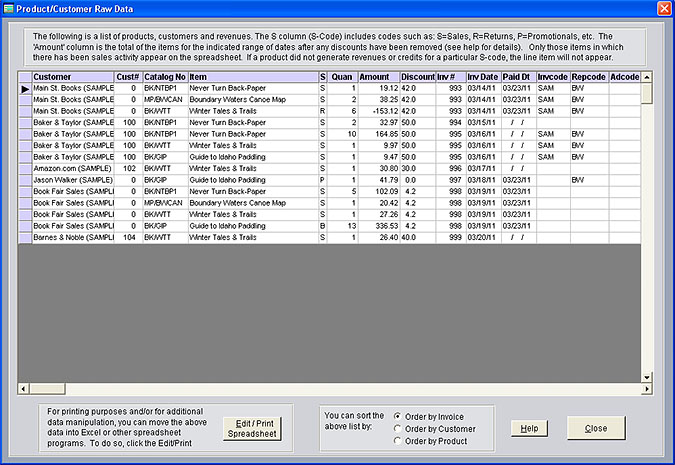
This report generates raw product revenue data. Raw data includes all customers whether they are included the Customer Number Database or not. It also includes all entries to the Item Area on the Main Invoice Screen whether the item has a catalog number or not. In most cases, you'll want to click on the "Edit/Print Spreadsheet" button which allows you to move the data into Microsoft Excel or a spreadsheet of your choice. Once in Excel, you can sort and distil the data into a form that meets your needs. Below is a sample spreadsheet with raw data:
When you view the spreadsheet, you are seeing raw data that AnyOrder has not manipulated it any way. Note that the "Price" column (it's named the "Amount" column on the screen display above) shows the total amount of the products sold minus any discounts: (Quantity X Price @) - Discount. If you remove the checkmark from "Zero-out promotionals, consignment and others" (above) it will also show a positive amount (and not zero) even if the items are promotional items ("P" sales code) or items which have been back ordered ("B") or have been backordered and fulfilled ("X"). When sorting in Excel, you may wish to sort by customer or product first, and then secondly by the "S" column (which contains the sales code). This will group the data by customer or product and further group by sales, returns, promotional items, etc. One handy feature in Excel that works very nicely with AnyOrder data is the "Sub-total" feature (found in Excel's "Data" menu). It is a quick way of calculating subtotals of each product or customer. For example let's say you need total sold of each of your products. First sort the entire spreadsheet by ITEM name. Then access the Sub-total feature from the "Data" menu and configure it as follows: At Each Change in: ITEM Use Function: SUM Add Subtotal: PRICE This will quickly give you total of each of your products. It's much faster than doing it manually. If you haven't used it, you'll find that it's a feature that you'll use again and again. You may sort the data by other columns, depending on your purposes. For example, you may sort by the "S" column and then by "Catalog Number" column. This would group like products together by their sales codes. Or you may sort by the "S" column and by "Customer." And, of course, they are many other ways to sort and manipulate the data in a spreadsheet. Note that you can also create raw product and invoice data in the Advanced Export portion of the program. To do so, build a profile and select the "Group Invoice Data by Product" Mode. The advantage of using technique is that it provides you with considerable control over what data actually appears on the spreadsheet. |